
 Charts
WebGL2 · Binance spot & perps · Custom indicators
Charts that keep up with the tape.
Live Binance charts rendered on the GPU. Draw, add indicators, and build custom indicators and chart types in TypeScript.

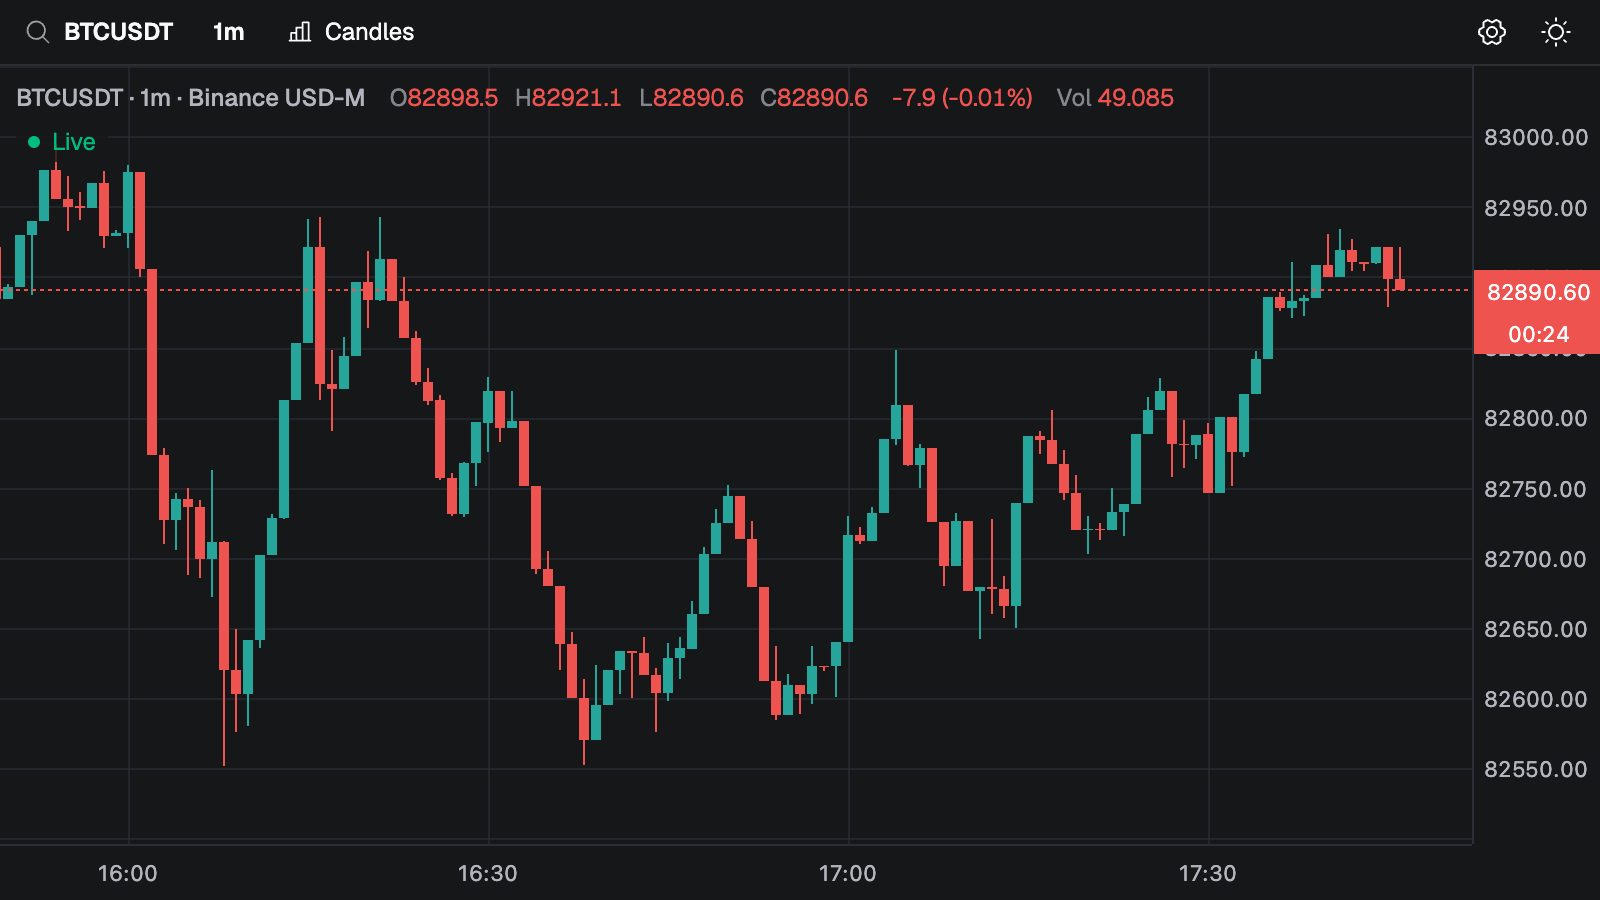
Everything you read the market with, in one fast chart.
- 01
WebGL speed
Candles, volume and drawings render on the GPU with WebGL2. Panning and zooming stay smooth on long histories.
- 02
Binance spot and perps
Every Binance spot pair and USD-M perpetual, with live bars streamed over websocket.
- 03
Drawings
Trend lines, rays, channels, Fibonacci tools, ranges and long or short positions, anchored to price and time.
- 04
Indicators
Volume profiles, footprint, TPO, session VWAP, delta histogram and liquidity heatmap, built in.
- 05
Custom indicators and chart types
Write them in TypeScript. Your script subscribes to market data and draws on the chart.
- 06Try it on a live market
Custom indicators and chart types
Your indicator is a TypeScript file.
Build them with tradingthings Create. Scripts run next to the chart and draw with the same renderer. A script adds an indicator on top of the candles, or replaces them as a new chart type.
- 1.Inputs become a settings dialog, with no UI code.
- 2.Subscribe to bars, trades or your own API.
- 3.Draw lines, shapes and labels, or replace the candles with your own chart type.
1import { defineScript, input } from "@tradingthings/tt-create"2 3// Simple moving average of the chart's closes, as one line.4export default defineScript({5 name: "Moving average",6 surface: { kind: "ChartOverlay" },7 inputs: {8 length: input.int({ default: 20, min: 1, label: "Length" }),9 color: input.color({ default: "#f59e0b", label: "Color" }),10 },11 subscribe: (ctx) => ({ bars: ctx.market.bars({ warmup: 20 }) }),12 state: () => ({}),13 draw: (_s, frame, g, ctx) => {14 const { time, close, length: count } = ctx.streams.bars15 const { length, color } = ctx.inputs16 const xy: number[] = []17 let sum = 018 19 for (let i = 0; i < count; i += 1) {20 sum += close[i]!21 if (i >= length) sum -= close[i - length]!22 if (i < length - 1) continue23 24 const x = frame.timeToX(time[i]!)25 if (x !== null) xy.push(x, frame.priceToY(sum / length))26 }27 28 g.polyline(xy, { color, width: 2 })29 },30})