

Custom indicators

Build your own indicators.

Build them with tradingthings Create. An indicator is one TypeScript file: it reads market data, keeps its own state and draws on the chart with the same renderer as the built-in indicators.

Example 01

Session VWAP with bands

Volume weighted average price of each session, with bands at N standard deviations. It draws on the price chart, over the candles.
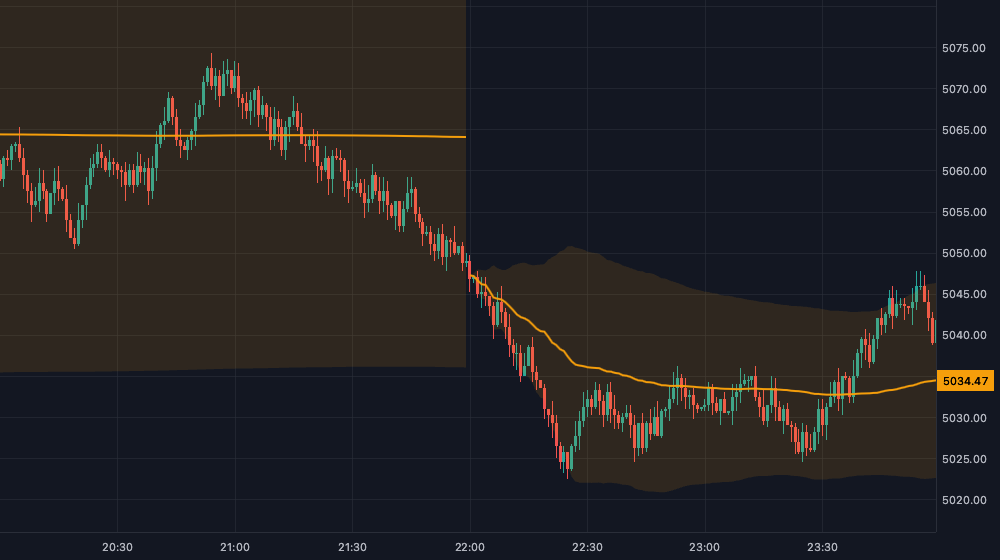
Session VWAP with standard deviation bands over candles
  • Loads bars back to the session open, so the first VWAP is complete.
  • Updates its sums once per bar. draw only reads the points.
  • One polyline and one band polygon per session, and the last VWAP on the price axis.
Read this example in the docs
session-vwap.ts
1import { defineScript, input, type ScriptBar } from "@tradingthings/tt-create";2 3/** Volume sums of a session's confirmed bars. */4interface Sums {5  readonly volume: number;6  /** Sum of typical price × volume. */7  readonly priceVolume: number;8  /** Sum of typical price² × volume, for the standard deviation. */9  readonly squareVolume: number;10}11 12interface VwapPoint {13  readonly time: number;14  /** Open of the point's session: the line breaks between sessions. */15  readonly session: number;16  readonly vwap: number;17  readonly deviation: number;18}19 20const EMPTY: Sums = { volume: 0, priceVolume: 0, squareVolume: 0 };21 22/**23 * Volume weighted average price of each session, with bands at N standard24 * deviations. The sums update once per bar in the handler, `draw` only25 * reads the points.26 */27export default defineScript({28  name: "Session VWAP",29  surface: { kind: "ChartOverlay" },30  inputs: {31    bands: input.float({ default: 2, min: 0, step: 0.5, label: "Bands (std dev)" }),32    line: input.lineStyle({ default: { color: "#f59e0b", width: 2 }, label: "VWAP" }),33    fill: input.color({ default: "rgba(245,158,11,0.12)", label: "Band fill" }),34  },35  subscribe: (ctx) => ({36    symbol: ctx.market.symbol(),37    // Back to the session open, so the first session's VWAP is complete.38    bars: ctx.market.bars({ warmup: "session" }),39  }),40  state: () => ({41    /** Open and close of the current session, `null` before the first bar. */42    session: null as { readonly open: number; readonly close: number } | null,43    /** Sums of the confirmed bars of the current session. */44    sums: EMPTY,45    /** Ascending by time. The forming bar's point is replaced on each update. */46    points: [] as VwapPoint[],47  }),48  on: {49    bars: (s, { bar, confirmed }, ctx) => {50      const last = s.points.at(-1);51 52      // Older bars arrive as backfill when the chart scrolls left. This53      // example skips them: its sums only run forward.54      if (last && bar.time < last.time) return;55 56      // `sessionOf` is slow (time zones): called once per session, not per bar.57      if (!s.session || bar.time >= s.session.close) {58        const session = ctx.streams.symbol.info.sessionOf(bar.time);59 60        if (session.isErr()) return;61 62        if (session.value.open !== s.session?.open) s.sums = EMPTY;63 64        s.session = { open: session.value.open, close: session.value.close };65      }66 67      const sums = addBar(s.sums, bar);68 69      if (sums.volume === 0) return;70 71      const vwap = sums.priceVolume / sums.volume;72      const variance = Math.max(0, sums.squareVolume / sums.volume - vwap * vwap);73      const point = { time: bar.time, session: s.session.open, vwap, deviation: Math.sqrt(variance) };74 75      if (last?.time === bar.time) s.points[s.points.length - 1] = point;76      else s.points.push(point);77 78      if (confirmed) s.sums = sums;79    },80  },81  draw: (s, frame, g, ctx) => {82    const { bands, line, fill } = ctx.inputs;83    const { from, to } = frame.visibleTime;84    let session: number | null = null;85    let center: number[] = [];86    let upper: number[] = [];87    let lower: number[] = [];88 89    const flush = () => {90      if (bands > 0 && upper.length >= 4) {91        // Upper edge left to right, lower edge back: one closed band.92        const outline = [...upper];93 94        for (let i = lower.length - 2; i >= 0; i -= 2) outline.push(lower[i]!, lower[i + 1]!);95 96        g.polygon(outline, fill);97      }98 99      g.polyline(center, line);100      center = [];101      upper = [];102      lower = [];103    };104 105    for (const p of s.points) {106      if (p.time < from || p.time > to) continue;107 108      const x = frame.timeToX(p.time);109 110      if (x === null) continue;111 112      if (p.session !== session) {113        flush();114        session = p.session;115      }116 117      center.push(x, frame.priceToY(p.vwap));118      upper.push(x, frame.priceToY(p.vwap + bands * p.deviation));119      lower.push(x, frame.priceToY(p.vwap - bands * p.deviation));120    }121 122    flush();123 124    const last = s.points.at(-1);125 126    if (last) g.priceLabel(last.vwap, frame.formatPrice(last.vwap), line.color, "#000000");127  },128  legend: (s, crosshairTime) => {129    const point = crosshairTime === null ? s.points.at(-1) : s.points.findLast((p) => p.time <= crosshairTime);130 131    return point ? [{ label: "VWAP", value: point.vwap.toFixed(2) }] : [];132  },133});134 135function addBar(sums: Sums, bar: ScriptBar): Sums {136  const typical = (bar.high + bar.low + bar.close) / 3;137 138  return {139    volume: sums.volume + bar.volume,140    priceVolume: sums.priceVolume + typical * bar.volume,141    squareVolume: sums.squareVolume + typical * typical * bar.volume,142  };143}144 
Example 02

Delta histogram

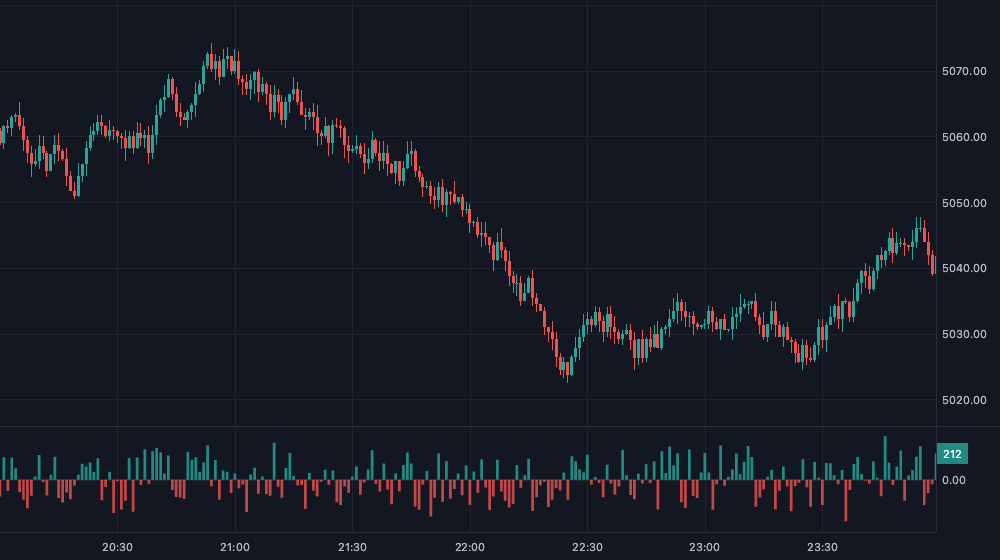
Buy minus sell volume of each bar, in its own pane below the price chart with its own price scale. The built-in delta histogram is this script.

Delta histogram pane below the price chart
  • Reads order flow per bar instead of candles.
  • Keeps the zero line in view and autoscales to the visible bars.
  • Hover shows the buy and sell split, right click marks bars.
Read this example in the docs
deltaHistogram.ts
1import type { OrderFlowBar } from "@tradingthings/tt-create";2import { defineScript, format, input } from "@tradingthings/tt-create";3 4/** Bar width as a share of the bar spacing. */5const BAR_WIDTH = 0.7;6 7/**8 * Buy minus sell volume of each bar in its own pane: above zero when buyers9 * lifted the ask more. Hover shows the split, right click marks bars.10 */11export default defineScript({12  name: "Delta histogram",13  surface: { kind: "ChartPane", weight: 0.25 },14  inputs: {15    up: input.color({ default: "rgba(38,166,154,0.8)", label: "Positive" }),16    down: input.color({ default: "rgba(239,83,80,0.8)", label: "Negative" }),17    marked: input.color({ default: "#f59e0b", label: "Marked" }),18  },19  subscribe: (ctx) => ({ orderFlow: ctx.market.orderFlow() }),20  state: () => ({ marked: new Set<number>() }),21  draw: (s, frame, g, ctx) => {22    const bars = ctx.streams.orderFlow.bars;23    const { from: fromTime, to: toTime } = frame.visibleTime;24    const zero = frame.priceToY(0);25    const width = Math.max(1, frame.barSpacing * BAR_WIDTH);26 27    g.keepVisible(0, 0);28    g.line(0, zero, frame.width, zero, { color: frame.theme.grid, width: 1 });29 30    for (let i = lowerBound(bars, frame.barTimeAt(fromTime) ?? fromTime); i < bars.length; i += 1) {31      const bar = bars[i]!;32 33      if (bar.time > toTime) break;34 35      const x = frame.timeToX(bar.time);36 37      if (x === null) continue;38 39      const { delta } = mapBarToDelta(bar);40      const y = frame.priceToY(delta);41      const rect = { x: x - width / 2, y: Math.min(y, zero), width, height: Math.max(1, Math.abs(zero - y)) };42      const color = s.marked.has(bar.time) ? ctx.inputs.marked : delta >= 0 ? ctx.inputs.up : ctx.inputs.down;43 44      g.priceValue(bar.time, delta);45      g.rect(rect.x, rect.y, rect.width, rect.height, color);46      g.hit(`bar-${bar.time}`, { type: "Rect", ...rect });47    }48 49    const last = bars.at(-1);50 51    if (!last) return;52 53    const { delta } = mapBarToDelta(last);54 55    g.priceLabel(delta, format.volume(delta), delta >= 0 ? ctx.inputs.up : ctx.inputs.down, "#ffffff");56  },57  onHover: (_s, event, ctx) => {58    const bar = findHitBar(ctx.streams.orderFlow.bars, event?.hitId ?? null);59 60    if (!bar) return null;61 62    const { delta, buy, sell } = mapBarToDelta(bar);63 64    return {65      title: new Date(bar.time).toLocaleTimeString(),66      rows: [67        { label: "Delta", value: format.volume(delta), color: delta >= 0 ? ctx.inputs.up : ctx.inputs.down },68        { label: "Buy", value: format.volume(buy) },69        { label: "Sell", value: format.volume(sell) },70      ],71    };72  },73  onContextMenu: (s, event, ctx) => {74    const bar = findHitBar(ctx.streams.orderFlow.bars, event.hitId);75 76    if (bar) {77      const marked = s.marked.has(bar.time);78 79      return [80        {81          label: marked ? "Unmark delta bar" : "Mark delta bar",82          onSelect: () => (marked ? s.marked.delete(bar.time) : s.marked.add(bar.time)),83        },84      ];85    }86 87    return s.marked.size > 0 ? [{ label: "Clear marked delta bars", onSelect: () => s.marked.clear() }] : [];88  },89  legend: (_s, crosshairTime, ctx) => {90    const bars = ctx.streams.orderFlow.bars;91    const bar = crosshairTime === null ? bars.at(-1) : bars[lowerBound(bars, crosshairTime)];92 93    if (!bar || (crosshairTime !== null && bar.time !== crosshairTime)) return [];94 95    const { delta } = mapBarToDelta(bar);96 97    return [{ label: "Delta", value: format.volume(delta), color: delta >= 0 ? ctx.inputs.up : ctx.inputs.down }];98  },99});100 101/** Volume at the ask is buying, at the bid selling. */102function mapBarToDelta(bar: OrderFlowBar): { readonly delta: number; readonly buy: number; readonly sell: number } {103  let buy = 0;104  let sell = 0;105 106  for (const level of bar.levels) {107    buy += level.ask;108    sell += level.bid;109  }110 111  return { delta: buy - sell, buy, sell };112}113 114function findHitBar(bars: readonly OrderFlowBar[], hitId: string | null): OrderFlowBar | null {115  if (!hitId?.startsWith("bar-")) return null;116 117  const time = Number(hitId.slice(4));118  const bar = bars[lowerBound(bars, time)];119 120  return bar?.time === time ? bar : null;121}122 123/** First index with `time >= target`. Live data is the newest: checked first. */124function lowerBound(list: readonly { readonly time: number }[], target: number): number {125  const last = list.length - 1;126 127  if (last < 0 || list[last]!.time < target) return list.length;128 129  let low = 0;130  let high = last;131 132  while (low < high) {133    const mid = (low + high) >> 1;134 135    if (list[mid]!.time < target) low = mid + 1;136    else high = mid;137  }138 139  return low;140}141 

What scripts can do

Anything the built-in indicators do, your script can do.

  • Three places to draw

    Over or under the candles, in a pane below the price chart with its own scale, or on a free canvas with no scales.

  • Any market data

    Subscribe to bars, order flow, trades, the order book or your own API. History loads before the first bar you see.

  • Settings without UI code

    Declare inputs like length, color or line style. They become the settings dialog and are saved per chart.

  • Fast by design

    Scripts draw with the chart's own GPU renderer. Handlers compute once per event, draw only emits shapes, and the indicator list shows each script's timings.

  • Interactive

    React to hover and clicks, add right-click menu entries and show tooltips and form widgets.

  • Browse all examples

AI skill

Describe it. Your AI assistant writes the script.

The tradingthings Create skill teaches Claude Code, Codex and other agents the whole script API, with the rules that make a script correct and every example from the docs.

  1. 1.

    Get the skill

    In the script editor, open "AI skill" in the toolbar. Download it as a folder or copy it for a chat.

  2. 2.

    Install it

    Claude Code: ~/.claude/skills/tradingthings-create/. Codex: ~/.codex/skills/tradingthings-create/. Other agents read SKILL.md.

  3. 3.

    Ask in one sentence

    The agent writes a .ts file. Paste it into the script editor or import it, then save. Type errors show before it runs.

You

Write a tradingthings Create script that marks every bar whose volume is twice the 20 bar average.

Agent

Using skill tradingthings-create. Wrote volume-spikes.ts.

Set up the AI skill

Write your first indicator in 5 minutes.