

Create an indicator
Your first indicator in 5 minutes, a moving average on the price chart.
An indicator is a script on one of three surfaces:
| Surface | Draws | Example |
|---|---|---|
ChartOverlay | on the price pane, in its time and price | Session VWAP |
ChartPane | in its own pane below the price pane, with its own price scale | Delta histogram |
Canvas | on a free pixel surface below the price pane, no scales | Trade size distribution |
1. Open the editor
In the indicator list at the top left of the chart, open "Add indicator" and pick "New script". The editor opens next to the chart with a moving average template, close to the script below.
2. Read the script
import { defineScript, input } from "@tradingthings/tt-create";

/** Simple moving average of the chart's closes, as one line. */
export default defineScript({
  name: "Moving average",
  surface: { kind: "ChartOverlay" },
  inputs: {
    length: input.int({ default: 20, min: 1, label: "Length" }),
    color: input.color({ default: "#f59e0b", label: "Color" }),
  },
  subscribe: (ctx) => ({
    // `warmup` loads 20 bars before the chart's first bar, so the line starts at it.
    bars: ctx.market.bars({ warmup: 20 }),
  }),
  state: () => ({}),
  draw: (_s, frame, g, ctx) => {
    const { time, close, length: count } = ctx.streams.bars;
    const { length, color } = ctx.inputs;
    const xy: number[] = [];
    let sum = 0;

    for (let i = 0; i < count; i += 1) {
      sum += close[i]!;

      if (i >= length) sum -= close[i - length]!;

      if (i < length - 1 || time[i]! < frame.visibleTime.from || time[i]! > frame.visibleTime.to) continue;

      const x = frame.timeToX(time[i]!);

      if (x !== null) xy.push(x, frame.priceToY(sum / length));
    }

    g.polyline(xy, { color, width: 2 });
  },
});
inputsbecome the settings dialog.ctx.inputs.lengthis anumberbecause itsdefaultis one.subscribeasks for the chart's bars.warmup: 20loads 20 bars before the chart's first one, so the line starts at the left edge.drawreads the bars fromctx.streams.bars, typed arrays of every bar received so far, and draws one polyline. It skips bars outsideframe.visibleTime.frame.timeToXreturnsnullwhen there are no bars. Always check it.
3. Save
Save (Ctrl+S) type checks, compiles and adds the script to the chart.
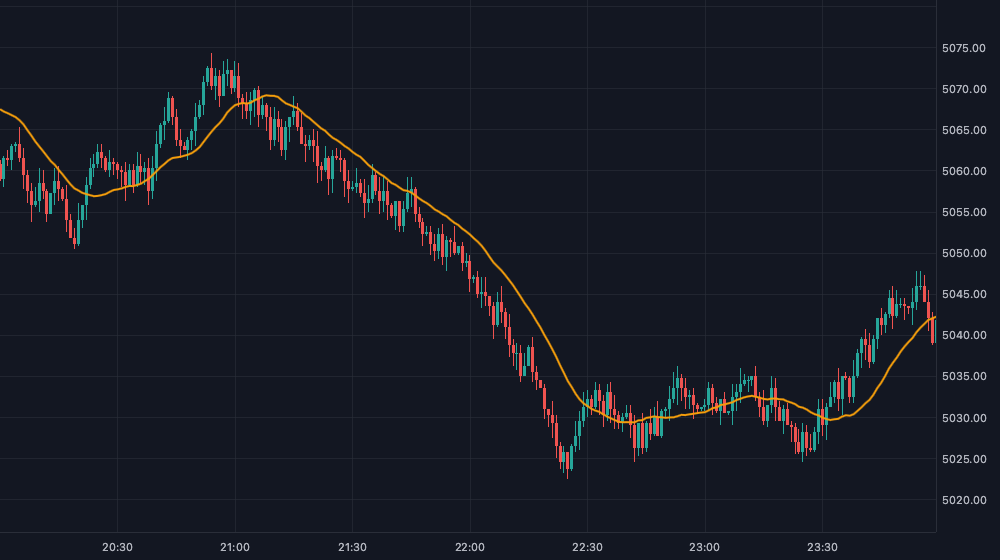
4. Change it
Change width: 2 to width: 3 and save. The chart reloads the script. Errors show in the editor's Problems panel with their line, runtime errors also in the indicator list. ctx.log(...) writes to the Console panel.
Next
- Keep state across events: State and draw.
- More data: Streams and history.
- Mouse, tooltips, menus: Interaction.
- Complete scripts: Examples.