

Create a chart type
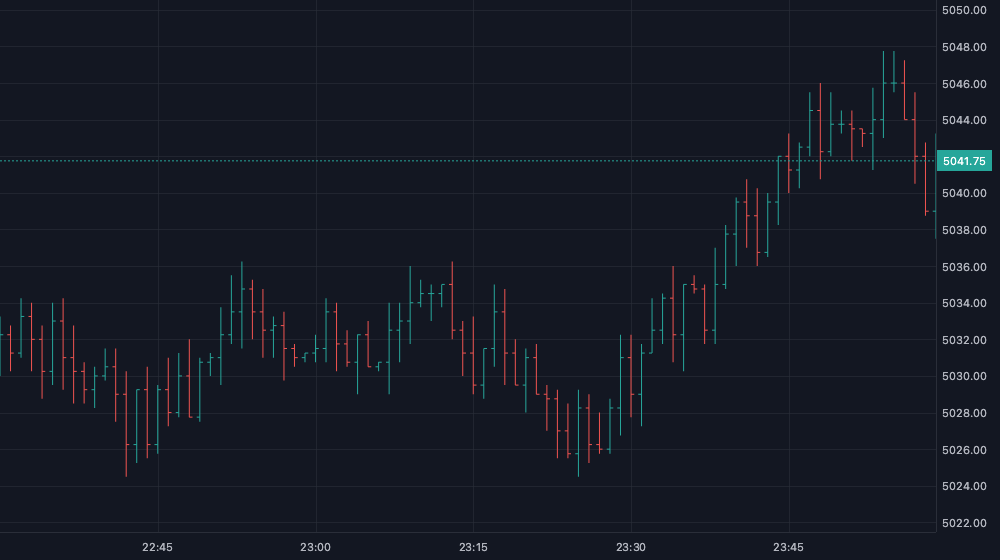
Replace the candles with your own bars, your first chart type in 5 minutes.
A chart type is a script with surface: { kind: "ChartSeries" }. The chart draws no candles for it: the script draws the bars on the price pane. Saved chart types show up under "Custom charts" in the chart type menu. Footprint and TPO are built this way.
1. Start from a template or a built-in
- Chart type menu, "Create your own chart": opens the editor with an OHLC bars template, close to the script below.
- Or pick Footprint or TPO in the chart type menu and use "Duplicate and edit". You get the full source of the built-in as your own script, named "Footprint (copy)". Change anything, save, and pick it under "Custom charts".
2. Read the script
import { defineScript, input } from "@tradingthings/tt-create";

/** Chart type: OHLC bars instead of candles, with the last price on the price axis. */
export default defineScript({
  name: "OHLC bars",
  surface: { kind: "ChartSeries" },
  inputs: {
    up: input.color({ default: "#26a69a", label: "Up" }),
    down: input.color({ default: "#ef5350", label: "Down" }),
  },
  subscribe: (ctx) => ({ bars: ctx.market.bars() }),
  state: () => ({}),
  draw: (_s, frame, g, ctx) => {
    const { time, open, high, low, close, length } = ctx.streams.bars;
    const { up, down } = ctx.inputs;
    const from = frame.barTimeAt(frame.visibleTime.from) ?? frame.visibleTime.from;
    const tick = Math.max(1, frame.barSpacing * 0.3);

    for (let i = 0; i < length; i += 1) {
      if (time[i]! < from || time[i]! > frame.visibleTime.to) continue;

      const x = frame.timeToX(time[i]!);

      if (x === null) continue;

      const color = close[i]! >= open[i]! ? up : down;

      // Autoscale and the crosshair magnet use these prices.
      g.priceValue(time[i]!, high[i]!);
      g.priceValue(time[i]!, low[i]!);
      g.priceValue(time[i]!, close[i]!);
      g.line(x, frame.priceToY(high[i]!), x, frame.priceToY(low[i]!), { color, width: 1 });
      g.line(x - tick, frame.priceToY(open[i]!), x, frame.priceToY(open[i]!), { color, width: 1 });
      g.line(x, frame.priceToY(close[i]!), x + tick, frame.priceToY(close[i]!), { color, width: 1 });
    }

    const last = length - 1;

    if (last < 0) return;

    const color = close[last]! >= open[last]! ? up : down;
    const y = frame.priceToY(close[last]!);

    // The chart draws no last price for a chart type: the script does.
    g.line(0, y, frame.width, y, { color, width: 1, dash: [2, 2] });
    g.priceLabel(close[last]!, frame.formatPrice(close[last]!), color, "#ffffff");
  },
});
3. What a chart type must do itself
The chart knows nothing about the bars a chart type draws. Three things are the script's job:
Autoscale and the magnet: g.priceValue
g.priceValue(time, price) tells the chart a price the series has at time. Autoscale fits the price scale to the priceValues of the bars in view, the crosshair magnet snaps to them, and the crosshair shows them. Call it in draw for each visible bar: high and low for the range, close for the magnet. It applies from the next frame.
Without it the price scale does not follow your bars.
Last price
The chart draws no last price line or label for a chart type. Draw them: a dashed g.line across the pane and g.priceLabel on the price axis, as at the end of the OHLC bars' draw.
Bars on the time axis
The chart still places the chart's bars on the time axis, so frame.timeToX(bar.time) is the center of that bar's slot and frame.barSpacing its width. Draw each bar around its x.
4. Save and pick it
Save, then pick it under "Custom charts" in the chart type menu. Inputs work as for indicators. The settings button in the status line opens them.
Next
- Footprint and TPO: complete chart types to learn from.
- Coordinates, Layers, Performance.