

Examples
Session VWAP with bands
Volume weighted average price per session, with standard deviation bands.
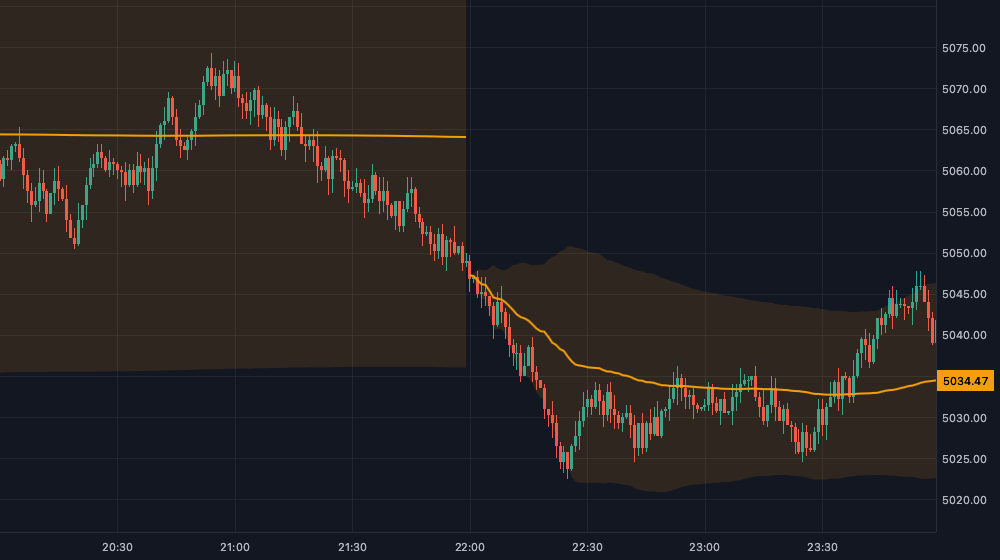
Shows: ChartOverlay. Bars with warmup: "session", sessions from sessionOf, sums updated once per bar in the handler, the forming bar replaced on each update. draw builds one polyline and one band polygon per session.
See also: Streams and history.
import { defineScript, input, type ScriptBar } from "@tradingthings/tt-create";

/** Volume sums of a session's confirmed bars. */
interface Sums {
  readonly volume: number;
  /** Sum of typical price × volume. */
  readonly priceVolume: number;
  /** Sum of typical price² × volume, for the standard deviation. */
  readonly squareVolume: number;
}

interface VwapPoint {
  readonly time: number;
  /** Open of the point's session: the line breaks between sessions. */
  readonly session: number;
  readonly vwap: number;
  readonly deviation: number;
}

const EMPTY: Sums = { volume: 0, priceVolume: 0, squareVolume: 0 };

/**
 * Volume weighted average price of each session, with bands at N standard
 * deviations. The sums update once per bar in the handler, `draw` only
 * reads the points.
 */
export default defineScript({
  name: "Session VWAP",
  surface: { kind: "ChartOverlay" },
  inputs: {
    bands: input.float({ default: 2, min: 0, step: 0.5, label: "Bands (std dev)" }),
    line: input.lineStyle({ default: { color: "#f59e0b", width: 2 }, label: "VWAP" }),
    fill: input.color({ default: "rgba(245,158,11,0.12)", label: "Band fill" }),
  },
  subscribe: (ctx) => ({
    symbol: ctx.market.symbol(),
    // Back to the session open, so the first session's VWAP is complete.
    bars: ctx.market.bars({ warmup: "session" }),
  }),
  state: () => ({
    /** Open and close of the current session, `null` before the first bar. */
    session: null as { readonly open: number; readonly close: number } | null,
    /** Sums of the confirmed bars of the current session. */
    sums: EMPTY,
    /** Ascending by time. The forming bar's point is replaced on each update. */
    points: [] as VwapPoint[],
  }),
  on: {
    bars: (s, { bar, confirmed }, ctx) => {
      const last = s.points.at(-1);

      // Older bars arrive as backfill when the chart scrolls left. This
      // example skips them: its sums only run forward.
      if (last && bar.time < last.time) return;

      // `sessionOf` is slow (time zones): called once per session, not per bar.
      if (!s.session || bar.time >= s.session.close) {
        const session = ctx.streams.symbol.info.sessionOf(bar.time);

        if (session.isErr()) return;

        if (session.value.open !== s.session?.open) s.sums = EMPTY;

        s.session = { open: session.value.open, close: session.value.close };
      }

      const sums = addBar(s.sums, bar);

      if (sums.volume === 0) return;

      const vwap = sums.priceVolume / sums.volume;
      const variance = Math.max(0, sums.squareVolume / sums.volume - vwap * vwap);
      const point = { time: bar.time, session: s.session.open, vwap, deviation: Math.sqrt(variance) };

      if (last?.time === bar.time) s.points[s.points.length - 1] = point;
      else s.points.push(point);

      if (confirmed) s.sums = sums;
    },
  },
  draw: (s, frame, g, ctx) => {
    const { bands, line, fill } = ctx.inputs;
    const { from, to } = frame.visibleTime;
    let session: number | null = null;
    let center: number[] = [];
    let upper: number[] = [];
    let lower: number[] = [];

    const flush = () => {
      if (bands > 0 && upper.length >= 4) {
        // Upper edge left to right, lower edge back: one closed band.
        const outline = [...upper];

        for (let i = lower.length - 2; i >= 0; i -= 2) outline.push(lower[i]!, lower[i + 1]!);

        g.polygon(outline, fill);
      }

      g.polyline(center, line);
      center = [];
      upper = [];
      lower = [];
    };

    for (const p of s.points) {
      if (p.time < from || p.time > to) continue;

      const x = frame.timeToX(p.time);

      if (x === null) continue;

      if (p.session !== session) {
        flush();
        session = p.session;
      }

      center.push(x, frame.priceToY(p.vwap));
      upper.push(x, frame.priceToY(p.vwap + bands * p.deviation));
      lower.push(x, frame.priceToY(p.vwap - bands * p.deviation));
    }

    flush();

    const last = s.points.at(-1);

    if (last) g.priceLabel(last.vwap, frame.formatPrice(last.vwap), line.color, "#000000");
  },
  legend: (s, crosshairTime) => {
    const point = crosshairTime === null ? s.points.at(-1) : s.points.findLast((p) => p.time <= crosshairTime);

    return point ? [{ label: "VWAP", value: point.vwap.toFixed(2) }] : [];
  },
});

function addBar(sums: Sums, bar: ScriptBar): Sums {
  const typical = (bar.high + bar.low + bar.close) / 3;

  return {
    volume: sums.volume + bar.volume,
    priceVolume: sums.priceVolume + typical * bar.volume,
    squareVolume: sums.squareVolume + typical * typical * bar.volume,
  };
}