
Examples
Footprint (chart type)
Bid and ask volume per price inside each bar, instead of candles.
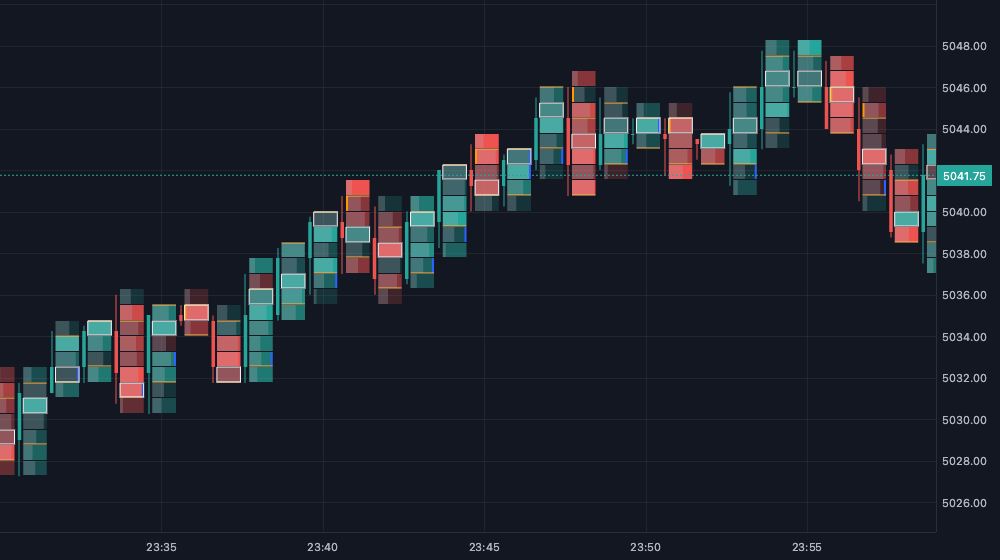
Shows: ChartSeries. Order flow per bar, several layouts and content modes, value area, imbalances, auto row size from the zoom, g.priceValue for autoscale and magnet, its own last price. The built-in Footprint: pick it in the chart type menu and use "Duplicate and edit" to start from it.
See also: Create a chart type.
import type { FootprintLevel } from "@tradingthings/tt-chart-lib";
import type { BarsView, ChartFrame, Graphics, InputValues, LegendValue, StreamStatus } from "@tradingthings/tt-create";
import { defineScript, format, group, input, profile, row, tab } from "@tradingthings/tt-create";

/**
 * Level of detail by zoom.
 *
 * - `Text`: numbers on colored cells.
 * - `Cells`: colored cells only.
 * - `Candles`: too small for cells, candles in the buying and selling colors.
 */
type Tier = "Text" | "Cells" | "Candles";

/** Px a row is higher than its font, so auto ticks per row fit the numbers. */
const ROW_PADDING = 3;
/** Numbers and stats need this much bar spacing, numbers this much row height in px. */
const TEXT_MIN_SPACING = 56;
const TEXT_MIN_ROW_HEIGHT = 10;
/** Cells need this much bar spacing and row height in px. */
const CELLS_MIN_SPACING = 4;
const CELLS_MIN_ROW_HEIGHT = 1;
/** Share of the bar spacing a bar's candle and cells cover. */
const COLUMN_WIDTH = 0.9;
/** Share of the column the candle next to the cells covers, and its max width in px. */
const CANDLE_SHARE = 0.12;
const MAX_CANDLE_WIDTH = 8;
/** Px between the candle and the cells. */
const CANDLE_GAP = 2;
/** Rows below this px height have no gap between them. */
const MIN_ROW_GAP_HEIGHT = 3;
/** Opacity steps of the cells and the weakest opacity in percent. */
const OPACITY_STEPS = 6;
const MIN_OPACITY_PCT = 20;
/** Opacity in percent of candles still waiting for their order flow. */
const WAITING_OPACITY_PCT = 35;
/** Px between numbers and the cell edge, and between "x" and the bid and ask numbers. */
const TEXT_PAD = 3;
const TIMES_GAP = 5;
/** Width of the imbalance marks at the cells' sides, wider for stacked imbalances, in px. */
const IMBALANCE_WIDTH = 2;
const STACKED_IMBALANCE_WIDTH = 4;
/** Px a stats row is higher than its font. */
const STATS_ROW_PADDING = 6;
/** Dash of the last price line, in px. */
const LAST_PRICE_DASH: readonly [number, number] = [2, 2];
const LAST_PRICE_TEXT_COLOR = "#ffffff";
const FONT_FAMILY = "-apple-system, BlinkMacSystemFont, 'Segoe UI', Roboto, sans-serif";

const inputs = [
  tab("Content", [
    group("Layout", {
      layout: input.select({
        default: "Candle left",
        options: ["Candle left", "Candle middle"],
        label: "Layout",
        tooltip: "Candle left: numbers right of the candle. Candle middle: bid left, ask right",
      }),
      content: input.select({
        default: "Bid x Ask",
        options: ["Bid x Ask", "Delta", "Volume", "Volume + Delta"],
        label: "Numbers",
      }),
      showVolumeBars: input.bool({ default: true, label: "Volume bars" }),
      showStats: input.bool({ default: true, label: "Volume and delta per bar" }),
    }),
    group("Rows", {
      rowMode: input.select({
        default: "Auto",
        options: ["Auto", "Manual"],
        label: "Ticks per row",
        tooltip: "Auto merges ticks until rows are tall enough for numbers",
      }),
      ticksPerRow: input.int({ default: 4, min: 1, step: 1, label: "Ticks", visibleWhen: { rowMode: "Manual" } }),
    }),
  ]),
  tab("Style", [
    group("Cells", {
      coloring: input.select({ default: "Delta", options: ["Delta", "Volume", "Solid"], label: "Cells by" }),
    }),
    group("Colors", { columns: 2 }, {
      askColor: input.color({ default: "#26a69a", label: "Buying" }),
      bidColor: input.color({ default: "#ef5350", label: "Selling" }),
      lowVolumeColor: input.color({ default: "#1e3a8a", label: "Low volume" }),
      highVolumeColor: input.color({ default: "#f59e0b", label: "High volume" }),
      solidColor: input.color({ default: "rgba(120, 123, 134, 0.35)", label: "Solid" }),
      volumeBarColor: input.color({ default: "rgba(178, 181, 190, 0.25)", label: "Volume bars" }),
    }),
    group("Text", { columns: 2 }, {
      textColor: input.color({ default: "#e0e3eb", label: "Numbers" }),
      fontSize: input.int({ default: 11, min: 6, max: 20, step: 1, label: "Font size" }),
      abbreviate: input.bool({ default: true, label: "Thousands as K" }),
    }),
  ]),
  tab("Highlights", [
    group("Profile", {
      poc: row({
        showPoc: input.bool({ default: true, label: "POC" }),
        pocColor: input.color({ default: "#f5f5f5" }),
      }),
      valueArea: row({
        showValueArea: input.bool({ default: true, label: "Value area" }),
        valueAreaPct: input.int({ default: 70, min: 1, max: 100, step: 5, tooltip: "Value area %" }),
        valueAreaColor: input.color({ default: "#ffb74d" }),
      }),
    }),
    group("Imbalances", {
      imbalances: row({
        showImbalances: input.bool({ default: true, label: "Imbalances" }),
        buyImbalanceColor: input.color({ default: "#2962ff", label: "Buy" }),
        sellImbalanceColor: input.color({ default: "#ff9800", label: "Sell" }),
      }),
      imbalancePct: input.int({
        default: 300,
        min: 100,
        step: 50,
        label: "Imbalance ratio %",
        tooltip: "Ask over the bid one row below, or bid over the ask one row above",
      }),
      stackedImbalances: input.int({
        default: 3,
        min: 2,
        step: 1,
        label: "Stacked imbalance rows",
        tooltip: "Rows in a row with an imbalance of the same side that get a wider mark",
      }),
    }),
  ]),
];

type Inputs = InputValues<typeof inputs>;
type Layout = Inputs["layout"];
type Content = Inputs["content"];

/** Cell colors by step, weakest first. */
interface Ramps {
  readonly ask: readonly string[];
  readonly bid: readonly string[];
  readonly volume: readonly string[];
}

/**
 * Footprint chart type: per bar, a candle next to one cell per row of ticks,
 * the cells colored by delta, by volume or solid, with numbers, volume bars,
 * the POC, the value area and diagonal imbalances. Zoomed out the numbers go,
 * then the cells. Bars without order flow draw candles from the bars stream:
 * order-flow bars have no OHLC. Bars whose order flow is still loading are
 * dimmed candles. Volume and delta per bar show under the bars.
 */
export default defineScript({
  name: "Footprint",
  surface: { kind: "ChartSeries" },
  inputs,
  subscribe: (ctx) => ({
    symbol: ctx.market.symbol(),
    bars: ctx.market.bars(),
    orderFlow: ctx.market.orderFlow(),
  }),
  // Inputs restart the script: the ramps follow its color inputs.
  state: (ctx): Ramps => ({
    ask: mapColorToRamp(ctx.inputs.askColor),
    bid: mapColorToRamp(ctx.inputs.bidColor),
    volume: mapColorsToHeatRamp(ctx.inputs.lowVolumeColor, ctx.inputs.highVolumeColor),
  }),
  draw: (ramps, frame, g, ctx) => {
    const { tickSize } = ctx.streams.symbol.info;
    const tickHeight = Math.abs(frame.priceToY(tickSize) - frame.priceToY(0));
    const ticksPerRow = mapInputsToTicksPerRow(ctx.inputs, tickHeight);
    const tier = mapZoomToTier(frame.barSpacing, tickHeight * ticksPerRow);
    const { bars } = ctx.streams;
    const flow = ctx.streams.orderFlow.bars;
    const { from, to } = frame.visibleTime;
    const { status } = ctx.streams.orderFlow;
    const options: DrawOptions = {
      ...ctx.inputs,
      ramps,
      tickSize,
      ticksPerRow,
      withText: tier === "Text",
      waitingAskColor: mapColorToOpacity(ctx.inputs.askColor, WAITING_OPACITY_PCT),
      waitingBidColor: mapColorToOpacity(ctx.inputs.bidColor, WAITING_OPACITY_PCT),
    };
    const withStats = ctx.inputs.showStats && tier !== "Candles" && frame.barSpacing >= TEXT_MIN_SPACING;
    const stats: BarStats[] = [];
    let k = 0;

    for (let i = lowerBound(bars.time, bars.length, frame.barTimeAt(from) ?? from); i < bars.length; i += 1) {
      const time = bars.time[i]!;

      if (time > to) break;

      // Autoscale and the magnet follow the bars.
      g.priceValue(time, bars.high[i]!);
      g.priceValue(time, bars.low[i]!);
      g.priceValue(time, bars.close[i]!);

      while (k < flow.length && flow[k]!.time < time) k += 1;

      const bar = flow[k]?.time === time ? flow[k]! : null;

      if (isWaitingForOrderFlow(status, time)) drawFullCandle(g, frame, bars, i, options, true);
      else if (tier === "Candles" || !bar || bar.levels.length === 0) drawFullCandle(g, frame, bars, i, options, false);
      else {
        drawBar(g, frame, bars, i, mapLevelsToRows(bar.levels, tickSize, ticksPerRow), options);

        if (withStats) stats.push({ time, ...mapLevelsToStats(bar.levels) });
      }
    }

    if (withStats) drawStats(g, frame, stats, options);

    drawLastPrice(g, frame, bars, options);
  },
  legend: (_ramps, crosshairTime, ctx) => {
    const { bars } = ctx.streams;
    const i = crosshairTime === null ? bars.length - 1 : lowerBound(bars.time, bars.length, crosshairTime);

    if (i < 0 || i >= bars.length || (crosshairTime !== null && bars.time[i] !== crosshairTime)) return [];

    const decimals = format.tickDecimals(ctx.streams.symbol.info.tickSize);
    const price = (value: number) => value.toFixed(decimals);
    const color = bars.close[i]! >= bars.open[i]! ? ctx.inputs.askColor : ctx.inputs.bidColor;
    const flow = ctx.streams.orderFlow.bars;
    const bar = flow.find((it) => it.time === bars.time[i]);
    const values: LegendValue[] = [
      { label: "O", value: price(bars.open[i]!), color },
      { label: "H", value: price(bars.high[i]!), color },
      { label: "L", value: price(bars.low[i]!), color },
      { label: "C", value: price(bars.close[i]!), color },
      { label: "Vol", value: format.volume(bars.volume[i]!) },
    ];

    if (!bar) return values;

    const { delta } = mapLevelsToStats(bar.levels);

    return [
      ...values,
      { label: "Δ", value: format.volume(delta), color: delta >= 0 ? ctx.inputs.askColor : ctx.inputs.bidColor },
    ];
  },
});

type DrawOptions = Inputs & {
  readonly ramps: Ramps;
  readonly tickSize: number;
  readonly ticksPerRow: number;
  readonly withText: boolean;
  /** Candle colors of bars waiting for their order flow. */
  readonly waitingAskColor: string;
  readonly waitingBidColor: string;
};

/** Horizontal extent in px. */
interface Span {
  readonly left: number;
  readonly right: number;
}

/** The cells of a bar: one column, or bid left and ask right of the candle. */
type Cells =
  | { readonly type: "Single"; readonly cell: Span }
  | { readonly type: "Split"; readonly bid: Span; readonly ask: Span };

export interface BarGeometry {
  readonly candle: Span;
  readonly cells: Cells;
  /** From the left edge to the right edge of the cells. */
  readonly area: Span;
}

/** Numbers of a row by content mode. `One` is drawn on `side` when bid and ask are split. */
export type RowNumbers =
  | { readonly type: "BidAsk"; readonly bid: string; readonly ask: string }
  | { readonly type: "One"; readonly text: string; readonly side: "Bid" | "Ask" }
  | { readonly type: "VolumeDelta"; readonly volume: string; readonly delta: string };

interface Imbalance {
  readonly buy: boolean;
  readonly sell: boolean;
}

interface BarStats {
  readonly time: number;
  readonly volume: number;
  readonly delta: number;
}

export function mapZoomToTier(barSpacing: number, rowHeight: number): Tier {
  if (barSpacing >= TEXT_MIN_SPACING && rowHeight >= TEXT_MIN_ROW_HEIGHT) return "Text";

  if (barSpacing >= CELLS_MIN_SPACING && rowHeight >= CELLS_MIN_ROW_HEIGHT) return "Cells";

  return "Candles";
}

function mapInputsToTicksPerRow(inputs: Inputs, tickHeight: number): number {
  switch (inputs.rowMode) {
    case "Auto":
      return mapTickHeightToTicksPerRow(tickHeight, inputs.fontSize + ROW_PADDING);
    case "Manual":
      return inputs.ticksPerRow;
    default:
      return inputs.rowMode satisfies never;
  }
}

/** Fewest ticks per row that make a row at least `minRowHeight` px high. */
export function mapTickHeightToTicksPerRow(tickHeight: number, minRowHeight: number): number {
  if (tickHeight <= 0) return 1;

  return Math.max(1, Math.ceil(minRowHeight / tickHeight));
}

/**
 * `levels`, sorted by price, merged into rows of `ticksPerRow` ticks. A row's
 * price is its lowest tick, a multiple of `ticksPerRow` ticks.
 */
export function mapLevelsToRows(
  levels: readonly FootprintLevel[],
  tickSize: number,
  ticksPerRow: number
): readonly FootprintLevel[] {
  if (ticksPerRow <= 1) return levels;

  const rows: { price: number; bid: number; ask: number }[] = [];

  for (const level of levels) {
    const price = Math.floor(Math.round(level.price / tickSize) / ticksPerRow) * ticksPerRow * tickSize;
    const row = rows[rows.length - 1];

    if (row?.price === price) {
      row.bid += level.bid;
      row.ask += level.ask;
    } else rows.push({ price, bid: level.bid, ask: level.ask });
  }

  return rows;
}

/**
 * Whether the order flow of the bar at `time` is still loading: nothing has
 * loaded yet, or the bar is older than the loaded range while older history
 * loads.
 */
export function isWaitingForOrderFlow(status: StreamStatus, time: number): boolean {
  switch (status.type) {
    case "Loading":
      return true;
    case "LoadingOlder":
      return time < status.from;
    case "Ready":
    case "Unavailable":
      return false;
    default:
      return status satisfies never;
  }
}

/**
 * Candle and cells of a bar centered at `center` in a column `width` px wide.
 * `Candle left` puts the candle at the column's left edge and the cells right
 * of it, `Candle middle` puts it at the center with bid cells left and ask
 * cells right.
 */
export function mapLayoutToGeometry(layout: Layout, center: number, width: number, dpr: number): BarGeometry {
  const left = center - width / 2;
  const right = center + width / 2;
  const candleWidth = Math.max(1 / dpr, Math.min(MAX_CANDLE_WIDTH, width * CANDLE_SHARE));

  switch (layout) {
    case "Candle left": {
      const cell = { left: left + candleWidth + CANDLE_GAP, right };

      return { candle: { left, right: left + candleWidth }, cells: { type: "Single", cell }, area: cell };
    }

    case "Candle middle": {
      const candle = { left: center - candleWidth / 2, right: center + candleWidth / 2 };

      return {
        candle,
        cells: {
          type: "Split",
          bid: { left, right: candle.left - CANDLE_GAP },
          ask: { left: candle.right + CANDLE_GAP, right },
        },
        area: { left, right },
      };
    }

    default:
      return layout satisfies never;
  }
}

export function mapRowToNumbers(level: FootprintLevel, content: Content, abbreviate: boolean): RowNumbers {
  const text = (value: number) => mapVolumeToText(value, abbreviate);
  const delta = level.ask - level.bid;

  switch (content) {
    case "Bid x Ask":
      return { type: "BidAsk", bid: text(level.bid), ask: text(level.ask) };
    case "Delta":
      return { type: "One", text: text(delta), side: delta >= 0 ? "Ask" : "Bid" };
    case "Volume":
      return { type: "One", text: text(level.bid + level.ask), side: level.ask >= level.bid ? "Ask" : "Bid" };
    case "Volume + Delta":
      return { type: "VolumeDelta", volume: text(level.bid + level.ask), delta: text(delta) };
    default:
      return content satisfies never;
  }
}

/** `value` as `format.volume`, or as `1.2K` or `12K` from 1,000 and `1.2M` from 1,000,000 when `abbreviate`. */
export function mapVolumeToText(value: number, abbreviate: boolean): string {
  const abs = Math.abs(value);

  if (!abbreviate || abs < 1_000) return format.volume(value);

  const [scaled, suffix] = abs < 1_000_000 ? [value / 1_000, "K"] : [value / 1_000_000, "M"];

  return `${Math.abs(scaled) < 10 ? scaled.toFixed(1) : Math.round(scaled)}${suffix}`;
}

/**
 * Diagonal imbalances of `level`: buying when its ask is `ratio` times the
 * bid one row below, selling when its bid is `ratio` times the ask one row
 * above. `below` and `above` are the neighboring rows of the bar, a
 * row without trades between them counts as 0.
 */
export function mapLevelToImbalance(
  below: FootprintLevel | undefined,
  level: FootprintLevel,
  above: FootprintLevel | undefined,
  rowSize: number,
  ratio: number
): Imbalance {
  const bidBelow = below && isNextRow(below.price, level.price, rowSize) ? below.bid : 0;
  const askAbove = above && isNextRow(level.price, above.price, rowSize) ? above.ask : 0;

  return {
    buy: below !== undefined && level.ask > 0 && level.ask >= ratio * bidBelow,
    sell: above !== undefined && level.bid > 0 && level.bid >= ratio * askAbove,
  };
}

/** Per row of `rows`, whether it is in a run of at least `min` adjacent rows whose `flags` are set. */
export function mapImbalancesToStacked(
  flags: readonly boolean[],
  rows: readonly FootprintLevel[],
  rowSize: number,
  min: number
): boolean[] {
  const stacked = flags.map(() => false);
  let start = -1;

  for (let k = 0; k <= flags.length; k += 1) {
    const set = k < flags.length && flags[k]!;

    if (set && start >= 0 && isNextRow(rows[k - 1]!.price, rows[k]!.price, rowSize)) continue;

    if (start >= 0 && k - start >= min) stacked.fill(true, start, k);

    start = set ? k : -1;
  }

  return stacked;
}

function mapLevelsToStats(levels: readonly FootprintLevel[]): { readonly volume: number; readonly delta: number } {
  let volume = 0;
  let delta = 0;

  for (const level of levels) {
    volume += level.bid + level.ask;
    delta += level.ask - level.bid;
  }

  return { volume, delta };
}

/** Whether `upper` is one row above `lower`. */
function isNextRow(lower: number, upper: number, rowSize: number): boolean {
  return Math.abs(upper - lower - rowSize) < rowSize / 2;
}

/** `color` at `OPACITY_STEPS` opacities from `MIN_OPACITY_PCT` to opaque. */
function mapColorToRamp(color: string): string[] {
  return Array.from({ length: OPACITY_STEPS }, (_, step) => mapColorToOpacity(color, mapStepToPct(step)));
}

/** `OPACITY_STEPS` colors from `low` to `high`. */
function mapColorsToHeatRamp(low: string, high: string): string[] {
  return Array.from({ length: OPACITY_STEPS }, (_, step) => {
    const pct = (100 * step) / Math.max(1, OPACITY_STEPS - 1);

    return `color-mix(in srgb, ${high} ${Math.round(pct)}%, ${low})`;
  });
}

function mapStepToPct(step: number): number {
  return MIN_OPACITY_PCT + ((100 - MIN_OPACITY_PCT) * step) / Math.max(1, OPACITY_STEPS - 1);
}

/** `color` at `pct` percent opacity. */
function mapColorToOpacity(color: string, pct: number): string {
  return `color-mix(in srgb, ${color} ${Math.round(pct)}%, transparent)`;
}

/** Color step, 0 to `OPACITY_STEPS - 1`, of `value` as a share of `max`. */
function mapShareToStep(value: number, max: number): number {
  if (max <= 0) return 0;

  return Math.min(OPACITY_STEPS - 1, Math.max(0, Math.floor((value / max) * OPACITY_STEPS)));
}

/** Index of the first of `length` times at or after `time`. */
function lowerBound(times: Float64Array, length: number, time: number): number {
  let lo = 0;
  let hi = length;

  while (lo < hi) {
    const mid = (lo + hi) >> 1;

    if (times[mid]! < time) lo = mid + 1;
    else hi = mid;
  }

  return lo;
}

/** `y` on a device pixel. */
function snapY(y: number, dpr: number): number {
  return Math.round(y * dpr) / dpr;
}

/** Bar `i` with its order flow `rows`: candle, cells, numbers and highlights. */
function drawBar(
  g: Graphics,
  frame: ChartFrame,
  bars: BarsView,
  i: number,
  rows: readonly FootprintLevel[],
  options: DrawOptions
): void {
  const center = frame.timeToX(bars.time[i]!);

  if (center === null || rows.length === 0) return;

  const { dpr, height } = frame;
  const rowSize = options.tickSize * options.ticksPerRow;
  const geometry = mapLayoutToGeometry(options.layout, center, frame.barSpacing * COLUMN_WIDTH, dpr);
  const { area } = geometry;
  const gap = 1 / dpr;
  const totals = rows.map((row) => row.bid + row.ask);
  let poc = 0;
  let maxDelta = 0;
  let maxSide = 0;

  for (let k = 0; k < rows.length; k += 1) {
    if (totals[k]! > totals[poc]!) poc = k;

    maxDelta = Math.max(maxDelta, Math.abs(rows[k]!.ask - rows[k]!.bid));
    maxSide = Math.max(maxSide, rows[k]!.bid, rows[k]!.ask);
  }

  const maxVolume = totals[poc]!;
  const ratio = options.imbalancePct / 100;
  const imbalances = rows.map((row, k) =>
    options.showImbalances
      ? mapLevelToImbalance(rows[k - 1], row, rows[k + 1], rowSize, ratio)
      : { buy: false, sell: false }
  );
  const stackedBuy = mapImbalancesToStacked(
    imbalances.map((it) => it.buy),
    rows,
    rowSize,
    options.stackedImbalances
  );
  const stackedSell = mapImbalancesToStacked(
    imbalances.map((it) => it.sell),
    rows,
    rowSize,
    options.stackedImbalances
  );
  const rowTop = (k: number) => snapY(frame.priceToY(rows[k]!.price + rowSize), dpr);
  const rowBottom = (k: number) => snapY(frame.priceToY(rows[k]!.price), dpr);

  drawCandle(g, frame, bars, i, geometry.candle, options.askColor, options.bidColor);

  for (let k = 0; k < rows.length; k += 1) {
    const row = rows[k]!;
    const top = rowTop(k);
    const bottom = rowBottom(k);

    if (bottom < 0 || top > height) continue;

    const rowHeight = bottom - top;
    const cellHeight = Math.max(gap, rowHeight >= MIN_ROW_GAP_HEIGHT ? rowHeight - gap : rowHeight);
    const color = mapRowToColor(row, totals[k]!, maxDelta, maxVolume, options);

    drawCells(g, geometry.cells, top, cellHeight, color);

    if (options.showVolumeBars) drawVolumeBars(g, geometry.cells, row, top, cellHeight, maxVolume, maxSide, options.volumeBarColor);

    const imbalance = imbalances[k]!;

    if (imbalance.sell) {
      const width = stackedSell[k] ? STACKED_IMBALANCE_WIDTH : IMBALANCE_WIDTH;

      g.rect(area.left, top, width, stackedSell[k] ? rowHeight : cellHeight, options.sellImbalanceColor);
    }

    if (imbalance.buy) {
      const width = stackedBuy[k] ? STACKED_IMBALANCE_WIDTH : IMBALANCE_WIDTH;

      g.rect(area.right - width, top, width, stackedBuy[k] ? rowHeight : cellHeight, options.buyImbalanceColor);
    }

    if (options.withText) {
      const numbers = mapRowToNumbers(row, options.content, options.abbreviate);

      drawNumbers(g, geometry.cells, numbers, top + rowHeight / 2, Math.min(options.fontSize, rowHeight - 2), imbalance, options);
    }
  }

  if (options.showValueArea) {
    const valueArea = profile.valueArea(totals, poc, options.valueAreaPct / 100);
    const style = { color: options.valueAreaColor, width: 1 };

    g.line(area.left, rowTop(valueArea.to), area.right, rowTop(valueArea.to), style);
    g.line(area.left, rowBottom(valueArea.from) - gap, area.right, rowBottom(valueArea.from) - gap, style);
  }

  if (!options.showPoc) return;

  const pocTop = rowTop(poc);
  const pocBottom = rowBottom(poc) - gap;

  g.polyline([area.left, pocTop, area.right, pocTop, area.right, pocBottom, area.left, pocBottom, area.left, pocTop], {
    color: options.pocColor,
    width: 1,
  });
}

function mapRowToColor(row: FootprintLevel, total: number, maxDelta: number, maxVolume: number, options: DrawOptions): string {
  switch (options.coloring) {
    case "Delta":
      return (row.ask >= row.bid ? options.ramps.ask : options.ramps.bid)[mapShareToStep(Math.abs(row.ask - row.bid), maxDelta)]!;
    case "Volume":
      return options.ramps.volume[mapShareToStep(total, maxVolume)]!;
    case "Solid":
      return options.solidColor;
    default:
      return options.coloring satisfies never;
  }
}

function drawCells(g: Graphics, cells: Cells, top: number, height: number, color: string): void {
  switch (cells.type) {
    case "Single":
      g.rect(cells.cell.left, top, cells.cell.right - cells.cell.left, height, color);

      return;
    case "Split":
      g.rect(cells.bid.left, top, cells.bid.right - cells.bid.left, height, color);
      g.rect(cells.ask.left, top, cells.ask.right - cells.ask.left, height, color);

      return;
    default:
      cells satisfies never;
  }
}

/**
 * Volume of `row` as a bar from the cell's left edge by its share of
 * `maxVolume`, or split: bid volume towards the left, ask volume towards the
 * right by their share of `maxSide`.
 */
function drawVolumeBars(
  g: Graphics,
  cells: Cells,
  row: FootprintLevel,
  top: number,
  height: number,
  maxVolume: number,
  maxSide: number,
  color: string
): void {
  switch (cells.type) {
    case "Single": {
      if (maxVolume <= 0) return;

      const { cell } = cells;

      g.rect(cell.left, top, ((cell.right - cell.left) * (row.bid + row.ask)) / maxVolume, height, color);

      return;
    }

    case "Split": {
      if (maxSide <= 0) return;

      const { bid, ask } = cells;
      const bidWidth = ((bid.right - bid.left) * row.bid) / maxSide;

      g.rect(bid.right - bidWidth, top, bidWidth, height, color);
      g.rect(ask.left, top, ((ask.right - ask.left) * row.ask) / maxSide, height, color);

      return;
    }

    default:
      cells satisfies never;
  }
}

function drawNumbers(
  g: Graphics,
  cells: Cells,
  numbers: RowNumbers,
  y: number,
  sizePx: number,
  imbalance: Imbalance,
  options: DrawOptions
): void {
  const put = (text: string, x: number, align: "left" | "center" | "right", highlight: string | null = null) =>
    g.text(text, x, y, {
      color: highlight ?? options.textColor,
      font: { family: FONT_FAMILY, sizePx, weight: highlight ? 700 : 400 },
      align,
      baseline: "middle",
    });
  const bidHighlight = imbalance.sell ? options.sellImbalanceColor : null;
  const askHighlight = imbalance.buy ? options.buyImbalanceColor : null;

  switch (cells.type) {
    case "Single": {
      const { cell } = cells;
      const mid = (cell.left + cell.right) / 2;

      switch (numbers.type) {
        case "BidAsk":
          put(numbers.bid, mid - TIMES_GAP, "right", bidHighlight);
          put("x", mid, "center");
          put(numbers.ask, mid + TIMES_GAP, "left", askHighlight);

          return;
        case "One":
          put(numbers.text, mid, "center");

          return;
        case "VolumeDelta":
          put(numbers.volume, cell.left + TEXT_PAD, "left");
          put(numbers.delta, cell.right - TEXT_PAD, "right");

          return;
        default:
          numbers satisfies never;
      }

      return;
    }

    case "Split": {
      const { bid, ask } = cells;

      switch (numbers.type) {
        case "BidAsk":
          put(numbers.bid, bid.right - TEXT_PAD, "right", bidHighlight);
          put(numbers.ask, ask.left + TEXT_PAD, "left", askHighlight);

          return;
        case "One":
          switch (numbers.side) {
            case "Bid":
              put(numbers.text, bid.right - TEXT_PAD, "right");

              return;
            case "Ask":
              put(numbers.text, ask.left + TEXT_PAD, "left");

              return;
            default:
              numbers.side satisfies never;
          }

          return;
        case "VolumeDelta":
          put(numbers.volume, bid.right - TEXT_PAD, "right");
          put(numbers.delta, ask.left + TEXT_PAD, "left");

          return;
        default:
          numbers satisfies never;
      }

      return;
    }

    default:
      cells satisfies never;
  }
}

/** Bar `i` as a candle over the full column: wick from high to low, body from open to close. `waiting` dims it. */
function drawFullCandle(
  g: Graphics,
  frame: ChartFrame,
  bars: BarsView,
  i: number,
  options: DrawOptions,
  waiting: boolean
): void {
  const center = frame.timeToX(bars.time[i]!);

  if (center === null) return;

  const width = Math.max(1 / frame.dpr, frame.barSpacing * COLUMN_WIDTH);
  const span = { left: center - width / 2, right: center + width / 2 };

  if (waiting) drawCandle(g, frame, bars, i, span, options.waitingAskColor, options.waitingBidColor);
  else drawCandle(g, frame, bars, i, span, options.askColor, options.bidColor);
}

/** Bar `i` as a candle in `span`: wick from high to low, body from open to close. */
function drawCandle(
  g: Graphics,
  frame: ChartFrame,
  bars: BarsView,
  i: number,
  span: Span,
  upColor: string,
  downColor: string
): void {
  const { dpr } = frame;
  const open = bars.open[i]!;
  const close = bars.close[i]!;
  const color = close >= open ? upColor : downColor;
  const x = Math.round(((span.left + span.right) / 2) * dpr) / dpr;
  const top = snapY(frame.priceToY(Math.max(open, close)), dpr);
  const bottom = snapY(frame.priceToY(Math.min(open, close)), dpr);

  g.line(x, frame.priceToY(bars.high[i]!), x, frame.priceToY(bars.low[i]!), { color, width: 1 });
  g.rect(span.left, top, Math.max(1 / dpr, span.right - span.left), Math.max(1 / dpr, bottom - top), color);
}

/**
 * Volume and delta of each bar in `stats` in two rows at the bottom of the
 * pane, labeled at the left. Above the cells' numbers: text paints above all
 * shapes of its layer.
 */
function drawStats(g: Graphics, frame: ChartFrame, stats: readonly BarStats[], options: DrawOptions): void {
  const rowHeight = options.fontSize + STATS_ROW_PADDING;
  const top = frame.height - 2 * rowHeight;
  const font = { family: FONT_FAMILY, sizePx: options.fontSize };
  const labels = [
    { text: "Volume", y: top + rowHeight / 2 },
    { text: "Delta", y: top + rowHeight * 1.5 },
  ];
  const labelWidth = Math.max(...labels.map((it) => g.measureText(it.text, font).width)) + 2 * TEXT_PAD;
  const put = (text: string, x: number, y: number, color: string, align: "left" | "center") =>
    g.text(text, x, y, { color, font, align, baseline: "middle" });

  g.layer("top", () => {
    g.rect(0, top, frame.width, 2 * rowHeight, frame.theme.background);
    g.line(0, top, frame.width, top, { color: frame.theme.grid, width: 1 });

    for (const label of labels) put(label.text, TEXT_PAD, label.y, frame.theme.text, "left");

    for (const bar of stats) {
      const x = frame.timeToX(bar.time);

      // Bars under the labels have no stats.
      if (x === null || x - frame.barSpacing / 2 < labelWidth) continue;

      put(mapVolumeToText(bar.volume, options.abbreviate), x, labels[0]!.y, options.textColor, "center");
      put(mapVolumeToText(bar.delta, options.abbreviate), x, labels[1]!.y, bar.delta >= 0 ? options.askColor : options.bidColor, "center");
    }
  });
}

/** The newest close as a dashed line across the pane and a price axis label. */
function drawLastPrice(g: Graphics, frame: ChartFrame, bars: BarsView, options: DrawOptions): void {
  const last = bars.length - 1;

  if (last < 0) return;

  const close = bars.close[last]!;
  const color = close >= bars.open[last]! ? options.askColor : options.bidColor;
  const y = frame.priceToY(close);

  g.line(0, y, frame.width, y, { color, width: 1, dash: LAST_PRICE_DASH });
  g.priceLabel(close, frame.formatPrice(close), color, LAST_PRICE_TEXT_COLOR);
}