

Examples
TPO (chart type)
Market profile of each session, one letter per period in every price row it traded.
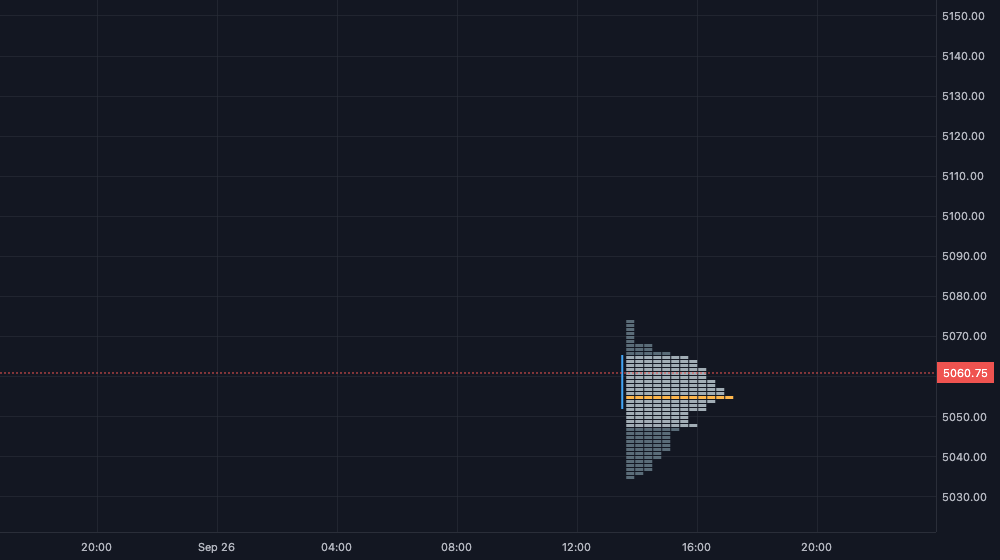
Shows: ChartSeries. 1 minute bars whatever the chart's timeframe, the tpo helper, profiles built lazily in draw and cached per session with a version. The built-in TPO: "Duplicate and edit" in the chart type menu.
See also: Create a chart type.
import type { TpoProfile } from "@tradingthings/tt-chart-lib";
import {
  defineScript,
  group,
  input,
  tab,
  tpo,
  type ChartFrame,
  type Graphics,
  type ScriptBar,
  type Session,
} from "@tradingthings/tt-create";

export type TpoSessionMode = "RTH" | "ETH" | "Day";

/** `[open, close)` in epoch ms. */
export interface TimeRange {
  readonly open: number;
  readonly close: number;
}

/**
 * The time range a profile covers inside a trading session: regular trading
 * hours, the overnight hours from the session open to the RTH open, or the
 * whole session.
 */
export const mapSessionToTpoRange = (session: Session, mode: TpoSessionMode): TimeRange => {
  switch (mode) {
    case "RTH":
      return session.rth;
    case "ETH":
      return { open: session.open, close: session.rth.open };
    case "Day":
      return { open: session.open, close: session.close };
  }
};

interface TpoSession {
  /** The trading session, to find a bar's session without `sessionOf`. */
  readonly session: Session;
  /** Part of the session in the profile. */
  readonly range: TimeRange;
  /** Bars inside `range`, ascending by time. */
  readonly bars: ScriptBar[];
  /** Bumped on each change of `bars`. */
  version: number;
  /** Profile of `version`, built by `draw`. `poc` is the POC price for the legend. */
  built: { readonly version: number; readonly profile: TpoProfile | null; readonly poc: string | null } | null;
}

interface TpoColors {
  readonly tpo: string;
  readonly valueArea: string;
  readonly poc: string;
  readonly initialBalance: string;
}

type Display = "Auto" | "Letters" | "Blocks";

/** Widest row as a share of the profile's time range. */
const SESSION_WIDTH = 0.8;
/** Widest letter cell in px. */
const MAX_CELL_WIDTH = 9;
/** `Auto` shows letters from this row height and cell width in px, else blocks. */
const MIN_LETTER_HEIGHT = 8;
const MIN_LETTER_WIDTH = 6;
const MIN_FONT_PX = 6;
const MAX_FONT_PX = 11;
/** Initial balance bar width and the gap between it and the letters. */
const IB_WIDTH = 2;
const IB_GAP = 3;
/** Dash of the last price line, in px. */
const LAST_PRICE_DASH: readonly [number, number] = [2, 2];
const LAST_PRICE_TEXT_COLOR = "#ffffff";

/**
 * TPO chart type: the market profile of each session from 1 minute bars, one
 * letter per period in every tick-aligned row the period traded in, drawn
 * from the session open. No candles.
 */
export default defineScript({
  name: "TPO",
  surface: { kind: "ChartSeries" },
  inputs: [
    tab("Inputs", [
      group("Profile", {
        session: input.select({ default: "RTH", options: ["RTH", "ETH", "Day"], label: "Session" }),
        period: input.int({ default: 30, min: 1, max: 240, label: "Period (minutes)" }),
        rowTicks: input.int({ default: 4, min: 1, max: 1000, label: "Row size (ticks)" }),
        display: input.select({ default: "Auto", options: ["Auto", "Letters", "Blocks"], label: "Display" }),
        valueArea: input.float({ default: 0.7, min: 0, max: 1, step: 0.05, label: "Value area" }),
        initialBalance: input.int({ default: 2, min: 0, max: 10, label: "Initial balance periods" }),
      }),
    ]),
    tab("Style", [
      group("Colors", { columns: 2 }, {
        tpo: input.color({ default: "rgba(120, 144, 156, 0.7)", label: "TPO" }),
        valueAreaColor: input.color({ default: "rgba(176, 190, 197, 0.9)", label: "Value area" }),
        poc: input.color({ default: "#ffb74d", label: "POC" }),
        initialBalanceColor: input.color({ default: "#42a5f5", label: "Initial balance" }),
      }),
    ]),
  ],
  subscribe: (ctx) => ({
    symbol: ctx.market.symbol(),
    // Letter periods need bars no longer than a period, whatever the chart's timeframe.
    bars: ctx.market.bars({ timeframe: "1m", warmup: "session" }),
  }),
  /** `sessions` ascending by open. */
  state: () => ({ sessions: [] as TpoSession[] }),
  on: {
    bars: (s, { bar }, ctx) => {
      let entry = findSession(s.sessions, bar.time);

      if (!entry) {
        const session = ctx.streams.symbol.info.sessionOf(bar.time);

        if (session.isErr()) return;

        entry = {
          session: session.value,
          range: mapSessionToTpoRange(session.value, ctx.inputs.session),
          bars: [],
          version: 0,
          built: null,
        };
        // Backfill brings older sessions.
        const after = s.sessions.findIndex((it) => it.session.open > session.value.open);

        s.sessions.splice(after === -1 ? s.sessions.length : after, 0, entry);
      }

      if (bar.time < entry.range.open || bar.time >= entry.range.close) return;

      const index = lowerBound(entry.bars, bar.time);

      if (entry.bars[index]?.time === bar.time) entry.bars[index] = bar;
      else entry.bars.splice(index, 0, bar);

      entry.version += 1;
    },
  },
  draw: (s, frame, g, ctx) => {
    const { inputs } = ctx;
    const settings = {
      periodMs: inputs.period * 60_000,
      tickSize: ctx.streams.symbol.info.tickSize,
      rowTicks: inputs.rowTicks,
      valueAreaFraction: inputs.valueArea,
      ibPeriods: inputs.initialBalance,
    };
    const colors: TpoColors = {
      tpo: inputs.tpo,
      valueArea: inputs.valueAreaColor,
      poc: inputs.poc,
      initialBalance: inputs.initialBalanceColor,
    };

    const { from, to } = frame.visibleTime;

    for (const entry of s.sessions) {
      if (entry.bars.length === 0) continue;

      if (entry.range.close < from || entry.range.open > to) continue;

      // Autoscale and the magnet follow the bars in view.
      for (let i = lowerBound(entry.bars, from); i < entry.bars.length && entry.bars[i]!.time <= to; i += 1) {
        g.priceValue(entry.bars[i]!.time, entry.bars[i]!.high);
        g.priceValue(entry.bars[i]!.time, entry.bars[i]!.low);
      }

      // Built here, cached on the session: history replays thousands of
      // bars, and only visible sessions need a profile.
      if (entry.built?.version !== entry.version) {
        const profile = tpo.build(entry.bars, { from: 0, to: entry.bars.length - 1 }, entry.range.open, settings);
        const poc = profile ? frame.formatPrice(profile.rows[profile.poc]!.price) : null;

        entry.built = { version: entry.version, profile, poc };
      }

      const { profile } = entry.built;
      const left = frame.timeToX(entry.range.open);
      const right = frame.timeToX(entry.range.close);

      if (!profile || left === null || right === null) continue;

      drawTpo(g, frame, profile, { left: left - frame.barSpacing / 2, right }, inputs.display, colors);
    }

    drawLastPrice(g, frame, s.sessions.findLast((it) => it.bars.length > 0)?.bars.at(-1) ?? null);
  },
  legend: (s, crosshairTime) => {
    const entry =
      crosshairTime === null
        ? s.sessions.findLast((it) => it.built)
        : s.sessions.find((it) => crosshairTime >= it.range.open && crosshairTime < it.range.close);
    const poc = entry?.built?.poc;

    return poc ? [{ label: "POC", value: poc }] : [];
  },
});

/** The session that holds `time`. Live bars are in the last one: searched from the end. */
function findSession(sessions: readonly TpoSession[], time: number): TpoSession | undefined {
  const entry = sessions.findLast((it) => it.session.open <= time);

  return entry && time < entry.session.close ? entry : undefined;
}

/** First index with `time >= target`. Live bars are the newest: checked first. */
function lowerBound(list: readonly { readonly time: number }[], target: number): number {
  const last = list.length - 1;

  if (last < 0 || list[last]!.time < target) return list.length;

  let low = 0;
  let high = last;

  while (low < high) {
    const mid = (low + high) >> 1;

    if (list[mid]!.time < target) low = mid + 1;
    else high = mid;
  }

  return low;
}

/** The newest close as a dashed line across the pane and a price axis label. */
function drawLastPrice(g: Graphics, frame: ChartFrame, bar: ScriptBar | null): void {
  if (!bar) return;

  const color = bar.close >= bar.open ? frame.theme.up : frame.theme.down;
  const y = frame.priceToY(bar.close);

  g.line(0, y, frame.width, y, { color, width: 1, dash: LAST_PRICE_DASH });
  g.priceLabel(bar.close, frame.formatPrice(bar.close), color, LAST_PRICE_TEXT_COLOR);
}

/**
 * Letters or blocks of each row from `box.left`, brighter in the value area,
 * the POC row in its own color, and the initial balance as a bar left of
 * them. Row edges sit on device pixels.
 */
function drawTpo(
  g: Graphics,
  frame: ChartFrame,
  profile: TpoProfile,
  box: { readonly left: number; readonly right: number },
  display: Display,
  colors: TpoColors
): void {
  const { rows, rowHeight, maxCount, poc, valueArea, initialBalance } = profile;
  const snap = (y: number) => Math.round(y * frame.dpr) / frame.dpr;
  const gap = 1 / frame.dpr;
  const lettersLeft = box.left + IB_WIDTH + IB_GAP;
  const cellWidth = Math.min(MAX_CELL_WIDTH, ((box.right - lettersLeft) * SESSION_WIDTH) / maxCount);
  // Decided once per profile, so snapping cannot mix letters and blocks.
  const rowPx = frame.priceToY(rows[0]!.price) - frame.priceToY(rows[0]!.price + rowHeight);
  const letters = display === "Auto" ? rowPx >= MIN_LETTER_HEIGHT && cellWidth >= MIN_LETTER_WIDTH : display === "Letters";
  const font = { ...frame.theme.font, sizePx: Math.max(MIN_FONT_PX, Math.min(MAX_FONT_PX, rowPx - 1)) };

  if (initialBalance) {
    const top = snap(frame.priceToY(initialBalance.high));
    const bottom = snap(frame.priceToY(initialBalance.low));

    g.rect(box.left, top, IB_WIDTH, Math.max(gap, bottom - top), colors.initialBalance);
  }

  for (let k = 0; k < rows.length; k += 1) {
    const row = rows[k]!;
    const top = snap(frame.priceToY(row.price + rowHeight));
    const height = snap(frame.priceToY(row.price)) - top;
    const color =
      k === poc ? colors.poc : k >= valueArea.from && k <= valueArea.to ? colors.valueArea : colors.tpo;

    row.periods.forEach((period, j) => {
      const x = lettersLeft + j * cellWidth;

      if (letters) {
        g.text(tpo.letter(period), x + cellWidth / 2, top + height / 2, {
          color,
          font,
          align: "center",
          baseline: "middle",
        });
      } else {
        g.rect(x, top, Math.max(gap, cellWidth - gap), Math.max(gap, height - gap), color);
      }
    });
  }
}