

Examples
Session volume profile
Volume by price of each session, with POC and value area.
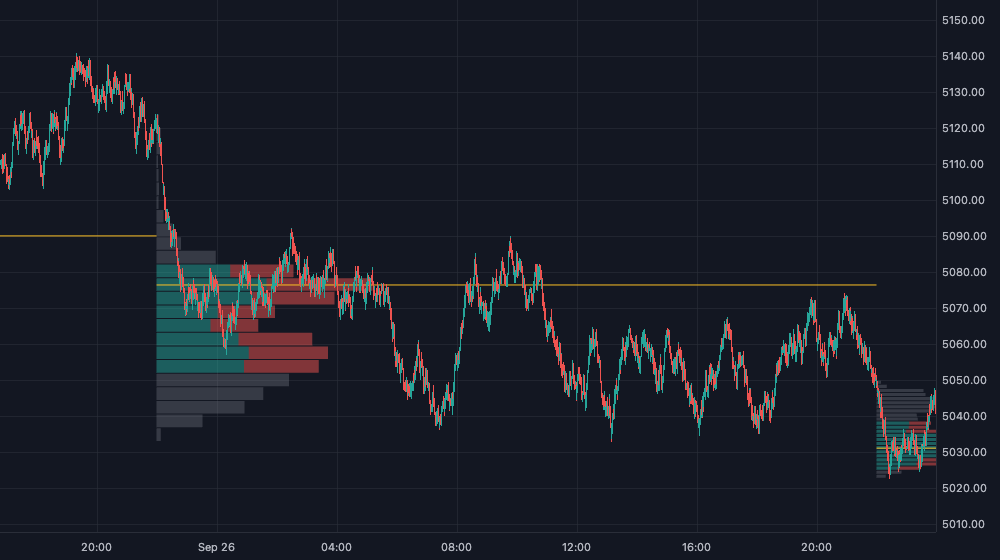
Shows: ChartOverlay in the bottom layer. 1 minute bars back to the session open (warmup: "session"), sessionOf once per session, and the profile helper for volume by price, POC and value area. The app's built-in profiles add order flow on top of this.
See also: Helpers.
import type { ProfileBar, VolumeProfile } from "@tradingthings/tt-chart-lib";
import { defineScript, group, input, profile, tab } from "@tradingthings/tt-create";

interface SessionProfile {
  readonly open: number;
  readonly close: number;
  readonly bars: ProfileBar[];
  profile: VolumeProfile | null;
}

/** Volume profile of each trading session, drawn from the session's start. */
export default defineScript({
  name: "Session volume profile",
  surface: { kind: "ChartOverlay", layer: "bottom" },
  inputs: [
    tab("Inputs", [
      group("Profile", {
        rows: input.int({ default: 24, min: 4, max: 200, label: "Rows" }),
        valueArea: input.float({ default: 0.7, min: 0.1, max: 1, step: 0.05, label: "Value area" }),
        width: input.float({ default: 0.3, min: 0.05, max: 1, label: "Width (share of session)" }),
      }),
    ]),
    tab("Style", [
      group("Colors", {
        up: input.color({ default: "rgba(38,166,154,0.5)" }),
        down: input.color({ default: "rgba(239,83,80,0.5)" }),
        outside: input.color({ default: "rgba(120,123,134,0.35)", label: "Outside value area" }),
        poc: input.lineStyle({ default: { color: "#fbbf24", width: 1 }, label: "POC" }),
      }),
    ]),
  ],
  subscribe: (ctx) => ({
    symbol: ctx.market.symbol(),
    bars: ctx.market.bars({ timeframe: "1m", warmup: "session" }),
  }),
  state: () => ({ sessions: [] as SessionProfile[] }),
  on: {
    bars: (s, { bar }, ctx) => {
      let current = s.sessions.at(-1);

      // `sessionOf` is slow (time zones): called once per session, not per bar.
      if (!current || bar.time >= current.close) {
        const session = ctx.streams.symbol.info.sessionOf(bar.time);

        if (session.isErr()) return;

        if (current?.open !== session.value.open) {
          current = { ...session.value, bars: [], profile: null };
          s.sessions.push(current);
        }
      }

      // The forming bar arrives again on each update: replace it.
      if (current.bars.at(-1)?.time === bar.time) current.bars[current.bars.length - 1] = bar;
      else current.bars.push(bar);

      current.profile = profile.build(
        current.bars,
        { from: 0, to: current.bars.length - 1 },
        ctx.inputs.rows,
        ctx.inputs.valueArea
      );
    },
  },
  draw: (s, frame, g, ctx) => {
    const { up, down, outside, poc, width } = ctx.inputs;

    for (const session of s.sessions) {
      if (session.close < frame.visibleTime.from || session.open > frame.visibleTime.to) continue;

      const p = session.profile;
      const left = frame.timeToX(session.open);
      const right = frame.timeToX(session.close);

      if (p === null || left === null || right === null) continue;

      const maxWidth = (right - left) * width;

      for (const [i, row] of p.rows.entries()) {
        const top = frame.priceToY(row.price + p.rowHeight);
        const height = Math.max(1, frame.priceToY(row.price) - top - 1);
        const upWidth = (row.up / p.maxTotal) * maxWidth;
        const downWidth = (row.down / p.maxTotal) * maxWidth;
        const inValueArea = i >= p.valueArea.from && i <= p.valueArea.to;

        g.rect(left, top, upWidth, height, inValueArea ? up : outside);
        g.rect(left + upWidth, top, downWidth, height, inValueArea ? down : outside);
      }

      const pocRow = p.rows[p.poc]!;
      const pocY = frame.priceToY(pocRow.price + p.rowHeight / 2);

      g.line(left, pocY, right, pocY, poc);
    }
  },
  legend: (s, crosshairTime) => {
    const session =
      crosshairTime === null
        ? s.sessions.at(-1)
        : s.sessions.find((it) => crosshairTime >= it.open && crosshairTime < it.close);
    const p = session?.profile;

    if (!p) return [];

    return [{ label: "POC", value: (p.rows[p.poc]!.price + p.rowHeight / 2).toFixed(2) }];
  },
});