

Examples
Liquidity heatmap
Resting book size per price over time, below the candles.
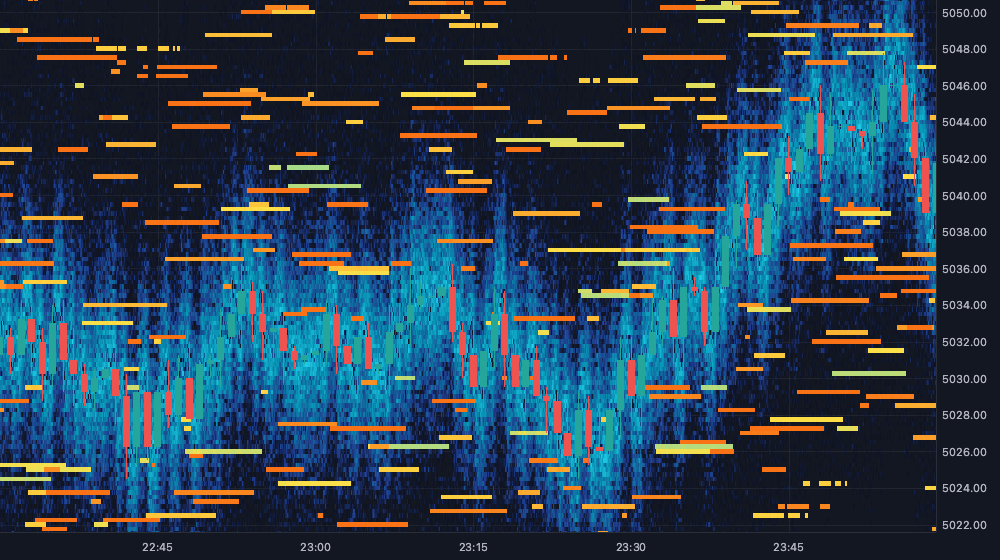
Shows: ChartOverlay in the bottom layer. The book stream, a texture grid from ctx.createGrid written column by column in the handler and scrolled with pushColumn, drawn as one GPU quad with a log color scale. The book is simulated for now, and the legend says so.
See also: Performance.
import type { BookSnapshot, ChartFrame, Graphics, TextureGrid } from "@tradingthings/tt-create";
import { defineScript, input } from "@tradingthings/tt-create";

/** Time slices kept. Older ones scroll out on the left. */
const COLUMNS = 2048;
/** Ticks around the first price. Levels outside are dropped. */
const ROWS = 1024;
const COLOR_MAPS = {
  Heat: ["rgba(0,0,0,0)", "#1e3a8a", "#0891b2", "#22d3ee", "#fde047", "#f97316"],
  Ocean: ["rgba(0,0,0,0)", "#0c4a6e", "#0284c7", "#7dd3fc", "#f0f9ff"],
  Mono: ["rgba(0,0,0,0)", "rgba(255,255,255,0.9)"],
} as const satisfies Record<string, readonly string[]>;

type ColorMapName = keyof typeof COLOR_MAPS;
const COLOR_MAP_NAMES = Object.keys(COLOR_MAPS) as ColorMapName[];
/** Max px a texture piece may be off the time axis before it is split. */
const SPLIT_TOLERANCE_PX = 0.5;
const SIMULATED_COLOR = "#f59e0b";

interface Heatmap {
  readonly grid: TextureGrid;
  /** Tick of row 0, the top row. */
  readonly topTick: number;
  /** Epoch ms where grid column 0 starts. */
  firstTime: number;
  /** Columns written so far, up to `COLUMNS`. */
  filled: number;
  /** Values of the column being written, reused. */
  readonly column: Float32Array;
}

/**
 * Resting book size per price over time below the candles: one texture, one
 * column per time slice, log color scale. Hover shows price, size and time.
 */
export default defineScript({
  name: "Liquidity heatmap",
  surface: { kind: "ChartOverlay", layer: "bottom" },
  inputs: {
    colorMap: input.select({ default: "Heat" as ColorMapName, options: COLOR_MAP_NAMES, label: "Color map" }),
    min: input.float({ default: 5, min: 0.1, label: "Size at first color" }),
    max: input.float({ default: 600, min: 1, label: "Size at full color" }),
    sliceSeconds: input.int({ default: 5, min: 2, max: 300, label: "Time slice (s)" }),
    wallSize: input.float({ default: 0, min: 0, label: "Only sizes above (0 shows all)" }),
  },
  subscribe: (ctx) => ({
    symbol: ctx.market.symbol(),
    book: ctx.market.book({ history: "2h" }),
  }),
  state: () => ({ heatmap: null as Heatmap | null, error: null as string | null }),
  on: {
    book: (s, book, ctx) => {
      if (s.error) return;

      const tick = ctx.streams.symbol.info.tickSize;
      const sliceMs = ctx.inputs.sliceSeconds * 1000;

      if (!s.heatmap) {
        const grid = ctx.createGrid(COLUMNS, ROWS);

        if (grid.isErr()) {
          s.error = grid.error.type;
          ctx.log("liquidity heatmap: no grid", grid.error);

          return;
        }

        s.heatmap = createHeatmap(grid.value, book, tick, sliceMs);
      }

      writeSnapshot(s.heatmap, book, tick, sliceMs, ctx.inputs.wallSize);
    },
  },
  draw: (s, frame, g, ctx) => {
    const map = s.heatmap;

    if (!map || map.filled === 0) return;

    const tick = ctx.streams.symbol.info.tickSize;
    const sliceMs = ctx.inputs.sliceSeconds * 1000;
    // Bar centers sit at their open time: a bar's time span starts half a bar left of it.
    const x = (column: number) => {
      const at = frame.timeToX(map.firstTime + column * sliceMs);

      return at === null ? null : at - frame.barSpacing / 2;
    };
    const firstColumn = Math.max(0, Math.floor((timeAtX(frame, 0) - map.firstTime) / sliceMs));
    const lastColumn = Math.min(map.filled, Math.ceil((timeAtX(frame, frame.width) - map.firstTime) / sliceMs));
    const firstRow = Math.max(0, map.topTick - Math.ceil(frame.visiblePrice.to / tick));
    const lastRow = Math.min(ROWS, map.topTick - Math.floor(frame.visiblePrice.from / tick) + 1);

    if (firstColumn >= lastColumn || firstRow >= lastRow) return;

    const colorMap = {
      stops: COLOR_MAPS[ctx.inputs.colorMap],
      scale: { type: "Log" as const, min: ctx.inputs.min, max: Math.max(ctx.inputs.max, ctx.inputs.min * 1.01) },
    };
    const top = frame.priceToY((map.topTick - firstRow + 0.5) * tick);
    const bottom = frame.priceToY((map.topTick - lastRow + 0.5) * tick);
    const rows = { row: firstRow, rows: lastRow - firstRow };

    drawColumns(x, firstColumn, lastColumn, (left, right, column, columns) =>
      g.texture(map.grid, { x: left, y: top, width: right - left, height: bottom - top }, colorMap, {
        column,
        columns,
        ...rows,
      })
    );
    drawHover(map, frame, g, tick, sliceMs);
  },
  legend: (s, _crosshairTime, ctx) => [
    ...(ctx.streams.book.simulated ? [{ label: "Book", value: "Simulated", color: SIMULATED_COLOR }] : []),
    ...(s.error ? [{ label: "Error", value: s.error, color: "#ef5350" }] : []),
  ],
});

function createHeatmap(grid: TextureGrid, book: BookSnapshot, tick: number, sliceMs: number): Heatmap {
  const price = book.bids[0]?.price ?? book.asks[0]?.price ?? 0;

  return {
    grid,
    topTick: Math.round(price / tick) + ROWS / 2,
    firstTime: Math.floor(book.time / sliceMs) * sliceMs,
    filled: 0,
    column: new Float32Array(ROWS),
  };
}

/** Writes `book` into its time slice's column, scrolling the grid when the slice is past the last column. */
function writeSnapshot(map: Heatmap, book: BookSnapshot, tick: number, sliceMs: number, wallSize: number): void {
  let column = Math.floor((book.time - map.firstTime) / sliceMs);

  if (column < 0) return;

  if (column >= COLUMNS) {
    const shift = column - COLUMNS + 1;

    map.column.fill(NaN);

    for (let i = 0; i < Math.min(shift, COLUMNS); i += 1) map.grid.pushColumn(map.column);

    map.firstTime += shift * sliceMs;
    column = COLUMNS - 1;
  }

  const values = map.column;

  values.fill(NaN);

  for (const levels of [book.bids, book.asks]) {
    for (const level of levels) {
      const row = map.topTick - Math.round(level.price / tick);

      if (row < 0 || row >= ROWS || level.size <= wallSize) continue;

      values[row] = level.size;
    }
  }

  map.grid.setColumn(column, values);
  map.filled = Math.max(map.filled, column + 1);
}

/**
 * Calls `draw` with pieces of `[from, to)` whose ends map straight to x:
 * splits where the time axis bends, at gaps between sessions.
 */
function drawColumns(
  x: (column: number) => number | null,
  from: number,
  to: number,
  draw: (left: number, right: number, column: number, columns: number) => void
): void {
  const left = x(from);
  const right = x(to);

  if (left === null || right === null || right <= left) return;

  if (to - from > 1) {
    const mid = (from + to) >> 1;
    const midX = x(mid);
    const straight = left + ((right - left) * (mid - from)) / (to - from);

    if (midX === null || Math.abs(midX - straight) > SPLIT_TOLERANCE_PX) {
      drawColumns(x, from, mid, draw);
      drawColumns(x, mid, to, draw);

      return;
    }
  }

  draw(left, right, from, to - from);
}

/** Price, size and time of the cell under the crosshair, in a box next to it. */
function drawHover(map: Heatmap, frame: ChartFrame, g: Graphics, tick: number, sliceMs: number): void {
  const crosshair = frame.crosshair;

  if (!crosshair) return;

  const time = timeAtX(frame, crosshair.x);
  const column = Math.floor((time - map.firstTime) / sliceMs);
  const tickIndex = Math.round(crosshair.price / tick);
  const row = map.topTick - tickIndex;

  if (column < 0 || column >= map.filled || row < 0 || row >= ROWS) return;

  const { grid } = map;
  const size = grid.values[((grid.ringStart + column) % grid.columns) * grid.rows + row]!;
  const sliceStart = map.firstTime + column * sliceMs;
  const text = `${frame.formatPrice(tickIndex * tick)}  ${size > 0 ? Math.round(size) : "–"}  ${new Date(sliceStart).toLocaleTimeString()}`;
  const width = g.measureText(text).width + 12;
  const boxX = Math.min(crosshair.x + 12, frame.width - width);
  const boxY = Math.max(0, crosshair.y - 26);

  g.layer("top", () => {
    g.rect(boxX, boxY, width, 20, "rgba(19,23,34,0.9)");
    g.text(text, boxX + 6, boxY + 10, { color: frame.theme.text });
  });
}

/** Epoch ms at pane x, on the heatmap's time axis: half a bar left of the bar centers. */
function timeAtX(frame: ChartFrame, x: number): number {
  return frame.xToTime(x + frame.barSpacing / 2) ?? 0;
}